



Current Exhibit
Spectral Encoding: Visualizing Mathematical Patterns by Juliet Fiss
Artist Statement
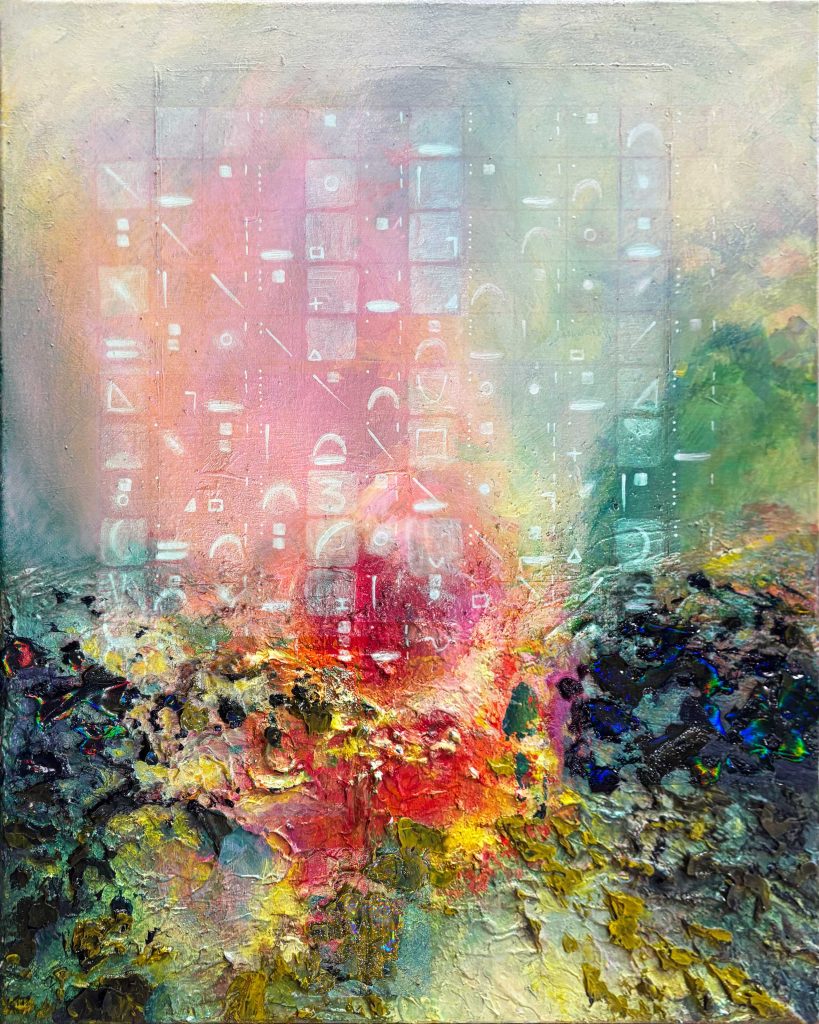
Mathematics is a language that describes the patterns and structures of our reality. Although textbooks most often present it using equations and black-and-white diagrams, we can also visualize mathematics through more artistic media: color, texture, shape, the formal qualities of artwork, and the optical properties of paint as a physical medium can all express mathematical concepts.
Spectral Encoding is a collection of paintings and prints of paintings about mathematics, science, and computer science. Juliet Fiss, a mathematical artist and computer scientist, created the artwork between 2021 and 2026. The paintings explore topics in number theory, signal processing, sorting algorithms, and data visualization.
Several series in the exhibition explore the same mathematical concept through variations. Changes in the number of elements, layout parameters, input data, and artistic painting decisions visually emphasize different properties of the same mathematical structure or algorithm.
Most artworks in this exhibition have an interactive companion page. Scan the QR code next to an artwork or visit positivesum.art to learn about the underlying mathematics, highlight patterns, and explore alternate inputs and parameters.
Number Theory Paintings
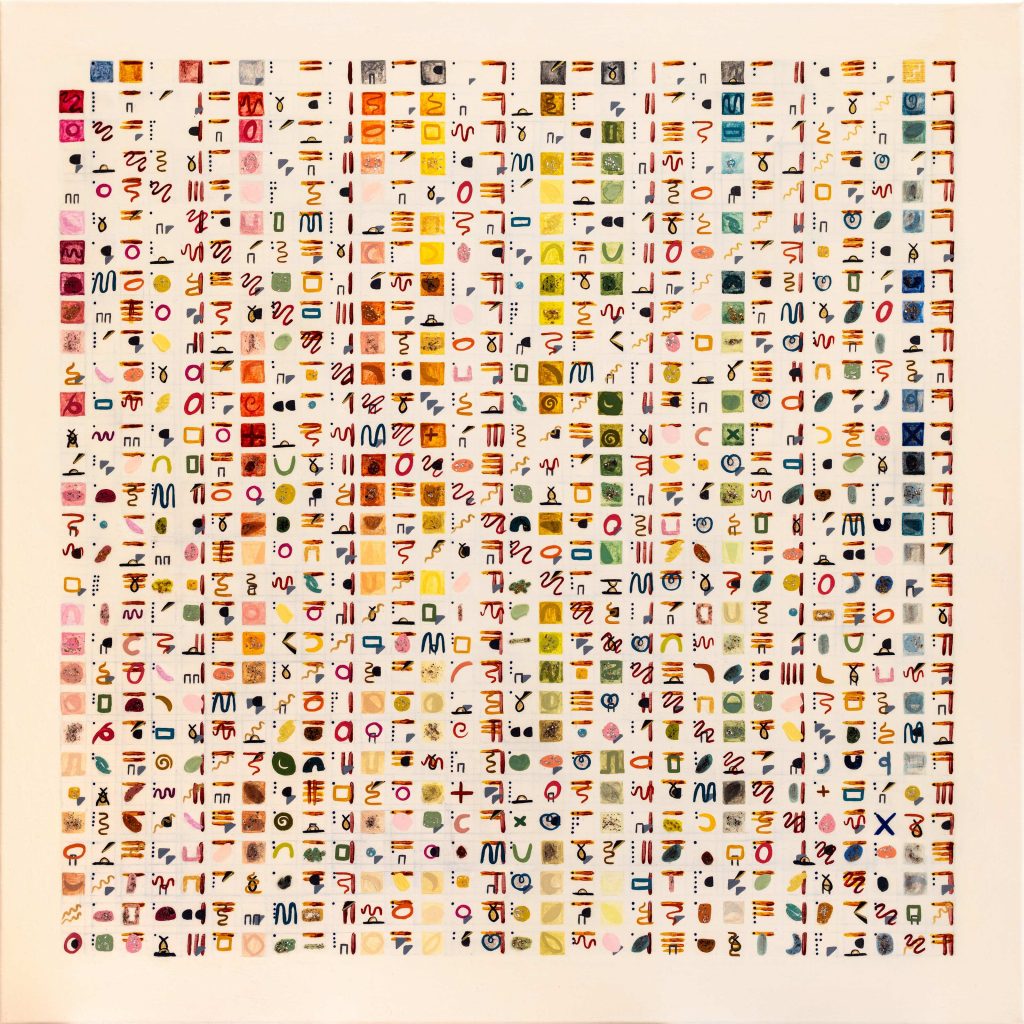
Number Theory Paintings arrange the positive integers in a grid or spiral and depict each integer according to its prime factors. Every integer greater than 1 is either prime or composite and has a unique decomposition into prime factors, called its prime factorization. A prime number has exactly two positive divisors: 1 and itself. A composite number has more than two positive divisors. The number 1 is neither prime nor composite. Each prime is represented by a unique color or symbol, and composite numbers combine the symbols of their prime factors. For example, if 2 is represented by a blue dot and 3 by a green dash, then 6 = 2 × 3 is represented by a blue dot and a green dash. When the integers are arranged using different geometries, arithmetic relationships and number-theoretic properties appear as lines and shapes in the paintings.
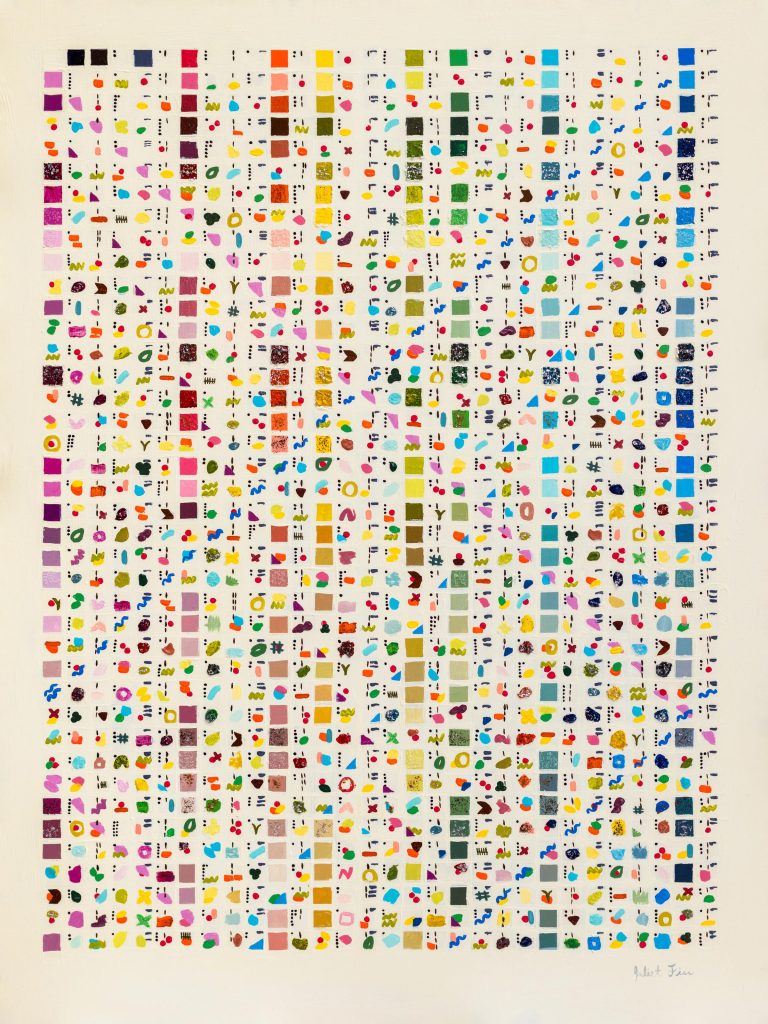
Interact: Scan the QR codes next to each piece or visit the interactive companion page to highlight patterns and numerical properties in each artwork. You can highlight integer sequences, such as triangular numbers and prime constellations, and visualize the patterns they create on paintings with different number layouts.
FFT Paintings
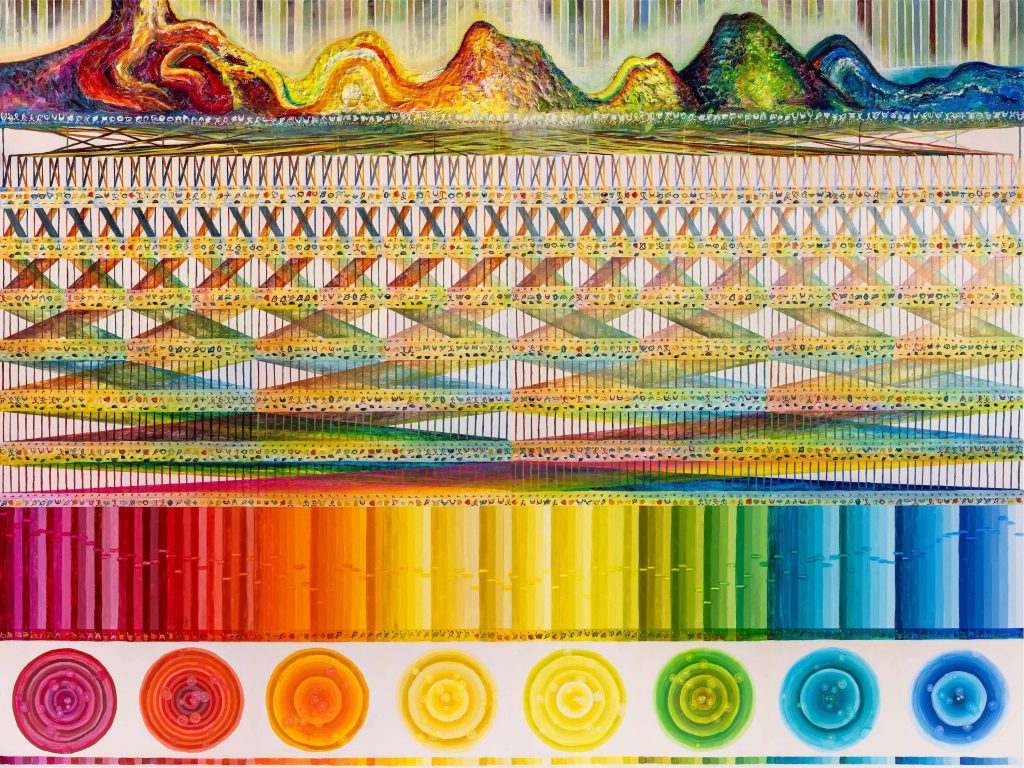
FFT Paintings depict the fast Fourier transform (FFT). Called “the most important numerical algorithm of our lifetime” by mathematician Gilbert Strang, the FFT is an essential algorithm in science, engineering, and mathematics. It efficiently computes the frequency spectrum of sampled data, revealing the magnitude and phase of the frequencies contained in the input. The input might be a digital audio waveform, ground-motion measurements from a seismometer, or brightness values sampled along a line in an image. In each painting, the top section represents the input data, the bottom section represents the output spectrum, and the middle section traces the data-flow graph of the FFT algorithm.
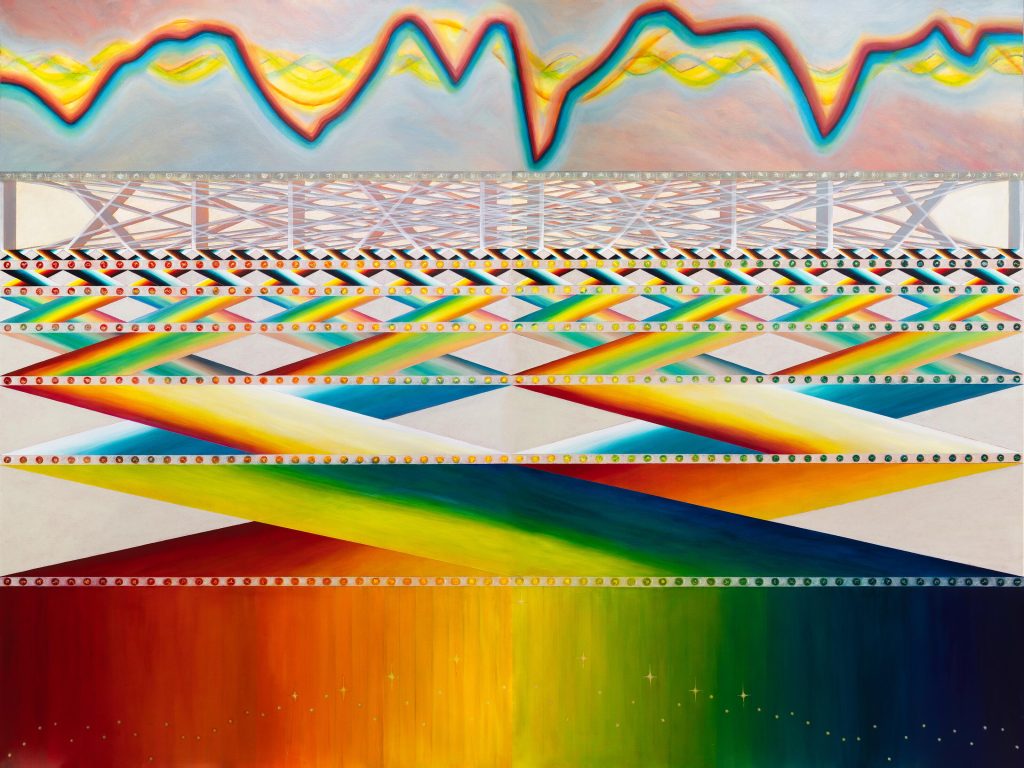
Interact: Scan the QR codes next to each piece or visit the interactive companion page to trace different inputs through the FFT depicted in the painting. You can visualize mathematical functions used in signal processing, such as sine waves and rectangular pulses, and change their parameters using sliders.
About the Artist
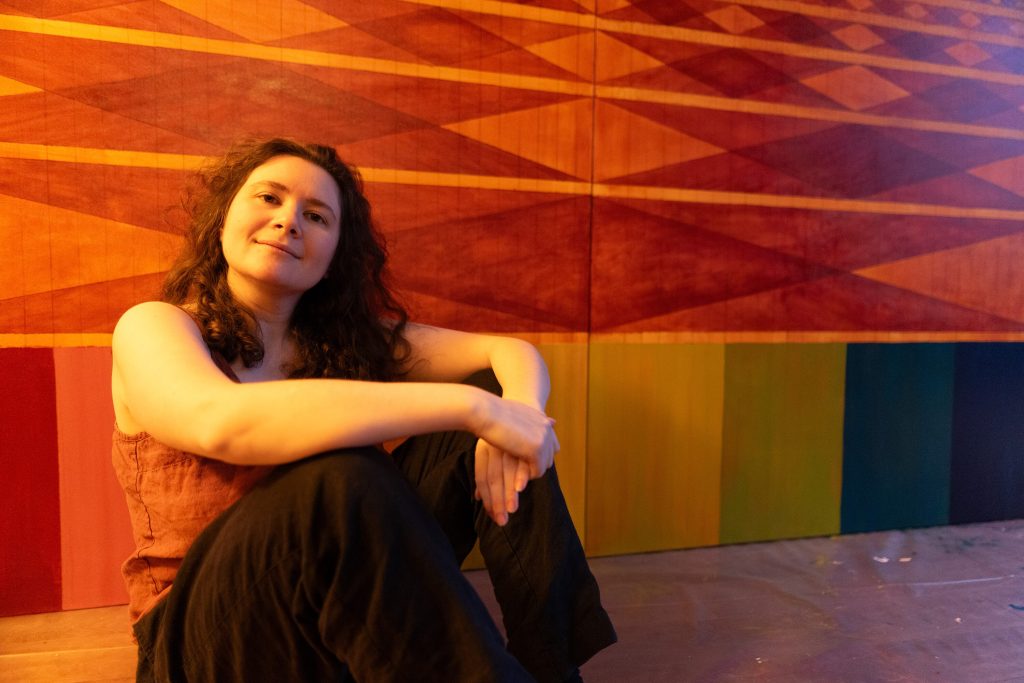
Juliet Fiss is a mathematical artist and computer scientist, originally from Minnesota, who lives and works in Kirkland, Washington. She holds a B.S. in Imaging Science from Rochester Institute of Technology and a Ph.D. in Computer Science and Engineering from the University of Washington.